A Periodic Table of Visualization Methods
I don't know about you, but I am always searching for better ways to communicate with my audiences. Metaphor, whether in storytelling or visual cues, can open up the minds of your audience and students. I have a PowerPoint of visualization ideas and graphics, which I refer to and update regularly. Image my delight, geek that I am, when I stumbled across this interactive Periodic Table of Visualization Methods! Simply mouseover each square in the table to view an example of a visualization to clarify that concept! Click here for the interactive table.
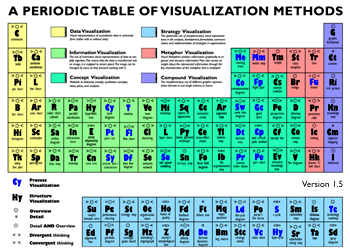 Go out to Visual-Literacy. Org to see the source of this brilliant tool!
No comments:
Post a Comment